 Forecasting
What is it?
Forecasting is a state of the art AI model which can predict price movements. Forecasting is a powerful tool which is intended to help people research on-chain assets. It is designed as a research tool.
How does it work?
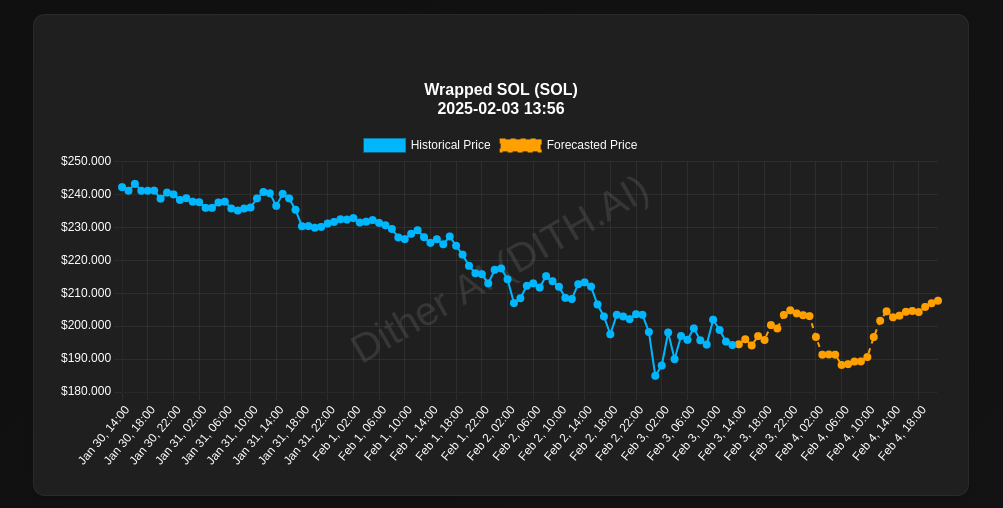
As you can see above, our AI system outputs ticks of closing price and time (yellow). The input to the system is also closing price and time (blue). The model generates a forecast using 'next token generation' where each token is a price point or subset of a price point.
Forecasting is as accurate as the signals that can be gleaned from the market. We always want to maximize the signal to noise ratio. Low cap memes like something that has just bonded from pumpfun has a very low signal to noise ratio. It has low liquidity, low real transaction volume and is highly influenced by individual traders. SOL on the other hand has a much higher signal to noise ratio. It has high liquidity, high transaction volume and low influence from individual traders. Assets like SOL will always have a higher signal to noise ratio and will be less influenced by random/psuedo-random events.
How do you Use it?
Forecasting by Dither is a research tool. It is one signal among many. We have seen the accuracy first hand but it is not the only signal that goes into our internal auto-trading systems. In the following paragraph we report on uses of Forecasting but do not offer financial advice. The following are second-hand reports of successful techniques tailored by individual traders.
Support/Resistances
Traders often use support and resistance lines to influence when to enter or exit a trade. Most will bundle these with other signals. Traders have reported that using support/resistance as an alert then forecasting off these lines has lead to improved trading outcomes. For instance, If SOL is around or hits a support line, then a forecast showing a clean reversal indicates to these traders they should look for an entrance. Conversely, if the forecast shows muddy movement about the support then the trader may wait to see what develops.
Fibonacci
This section will be short. The support/resistance line technique has also been reported for Fibonacci extensions and retraces. Again, this is one signal among many. These traders are incorporating the forecasting into an already effective trading strategy.
DLMM
There are multiple strategies that can be used for DLMMs and forecasting. We will focus on two-sided pools and one-sided pools. The two-sided pools will be used to derive yield. The one-sided pools will be used to exit or enter a position. If you are unfamiliar with DLMMs, you can read about them here.
Two-sided DLMM
When a forecast shows limited movement to the upside or downside, that does not mean an opportunity does not exist. Many traders have begun using DLMM pools with forecasting to improve their yield. It's been reported that users will take assets they want to hold then use forecasting to determine the most likely range for the asset. If it is a relatively stable range then they will setup a DLMM position using the price range to determine the bin size and span.
For instance, if the range is tight then they will use smaller bin steps like 20. If it is a larger range (more volatility forecast) then they might use a bin step size of 200. The goal of this is to capture the full range of price movements without exiting the full span of the DLMM. The DLMM will only earn fees when the trading is happening within its bounds. Forecasting allows these LP earners to maximize yield and time within range.
One-Sided DLMM
Two-sided DLMM can be used when trends are sideways. However, if someone wants to enter or exit a position without impacting charts then a one-sided DLMM can be the most beneficial apparatus. The user doesn't need these entries or exits to be permanaent. Scalping a quick dip is also available using this strategy.
The key difference is the users only enter with one token instead of a pair. For this to work, the other tokens price will need to increase (buy into the pool) or decrease (sell into the pool). In this situation, the traders are looking for a trend change. The magnitude of the trend will determine the bin step size. Traders have successfully used forecasting to trade out of tokens using a bounce off resistance levels (like above) and using a DLMM to capture yield and exit into a different token. The forecast act as a signal for timing and bin step sizing.
How do I access?
You can view generated forecasts at Forecasting!
To create forecasts you will need to hold 50k DITH and verify with out DitherSeerBot on telegram. 50K DITH is the threshold to get Premium access to our tools.
Other Premium benefits include our DegenScope, a premium filtered pumpfun feed provided through DitherSeerBot, and our Premium alerts feed.